A practical toolkit for technology strategy
In my work, I have often sought to be more effective in creating technology strategy. It is not enough to only have a good idea; I need a clear path from a high-level vision to tangible, on-the-ground execution. This is what makes ‘strategy’ practical and applicable. This requires a complete toolkit that allows us to see the landscape, diagnose our position, and then act with purpose.
In the past months, I have seen some great posts with practical ideas on how to be better at strategy. In this post, I will combine insights from these thinkers. It starts with understanding the terrain using the powerful mapping tools detailed in an excellent article by Alex Ewerlöf, Wardley Maps & Pace Layering for Senior Tech Leads.
The strategic landscape: Seeing the terrain
Before you can plan a journey, you need a map. In technology strategy, two frameworks provide this essential high-level view.
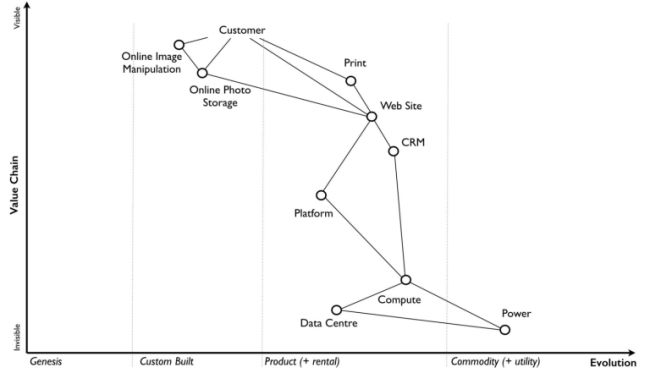
Wardley Mapping: A GPS for your value chain
A Wardley Map is a visual tool for understanding your business and technology, as detailed in Alex’s article. It plots your value chain (from user needs down to the power supply) against an axis of evolution—from new Genesis ideas to standardised Commodities.
A visual map is a great way to explain complex tech dependencies and strategic choices to CPO, CTO, or even CFO.
This is far more than an academic exercise. It has direct, practical applications:
- It makes invisible value visible. The map shows how foundational components like databases and APIs, while hidden from the user, are critical to delivering value. This helps justify investment in non-feature work.
- It provides a language for strategic decisions. The evolution axis gives us a powerful way to discuss trade-offs. We can clearly show why building a custom authentication system (‘Custom-Built’) is inefficient when a mature ‘Product’ like Okta exists, freeing up resources for work that truly differentiates us.
- It helps spot risks and opportunities. Seeing a critical user-facing feature dependent on a fragile ‘Genesis’ component is an immediate red flag for technical debt. Conversely, seeing a component that could be moved to ‘Commodity’ highlights an opportunity for cost savings.
Pace Layering: Governing the speed of change
Pace Layering, adapted from Stewart Brand’s work in his essay Pace Layering: How Complex Systems Learn and Keep Learning, provides a complementary view. It categorises systems based on their required rate of change. As Brand famously wrote:
Fast learns, slow remembers. … Fast gets all our attention, slow has all the power.
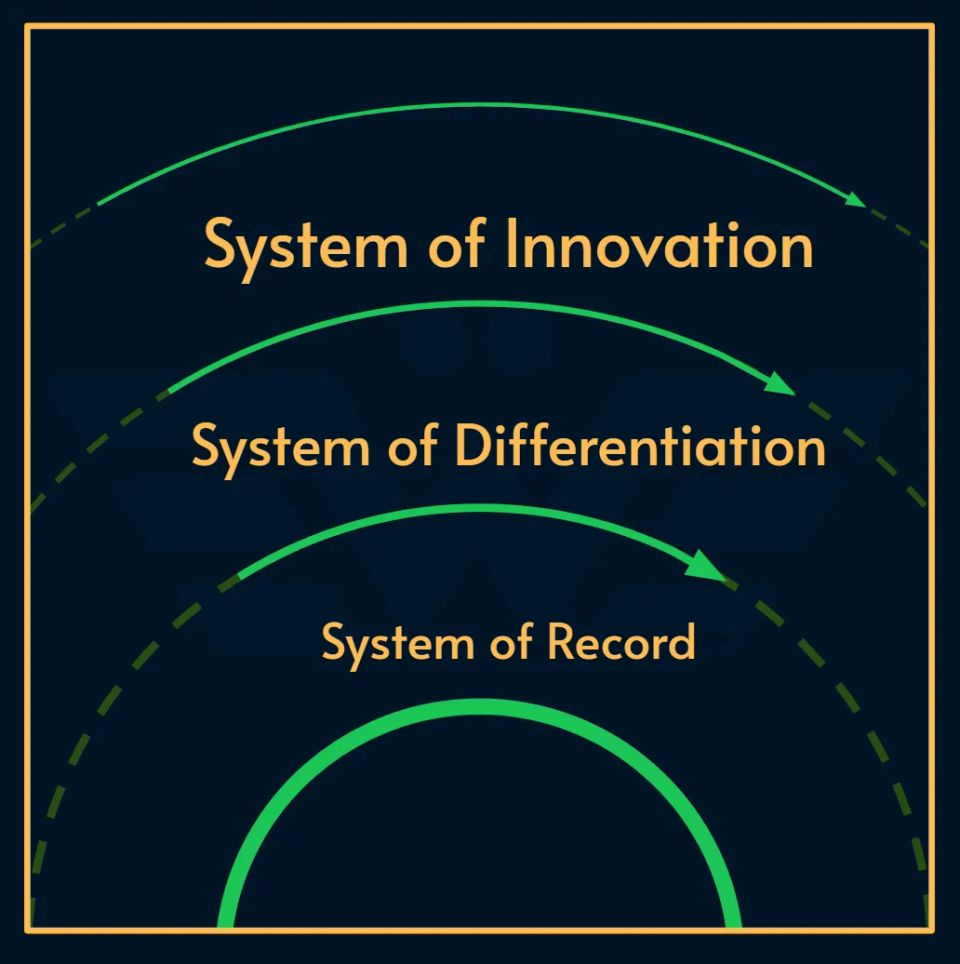
This translates into three layers for our technology systems:
- Systems of Innovation (SOI): Fast-changing experiments where learning is the goal.
- Systems of Differentiation (SOD): Your unique business logic; your competitive edge.
- Systems of Record (SOR): The slow, stable foundations that must not fail.
This framework is essential for effective governance. It justifies why an SOI team can use CI/CD to deploy daily, while the SOR team has a quarterly release cycle with rigorous controls.
Combining the two
In his article, Alex gives an excellent perspective on combining the two:
This is where it gets really powerful:
- Wardley Maps give you the “lay of the land” – the strategic “why” and “what.” They help you see opportunities, competitor moves, and user needs.
- Pace Layering then helps you organize your internal response – the “how.” A Wardley insight might identify a new SOI, which then gets agile funding and rapid iteration.
The Systems Engineering Perspective: From Maps to Artifacts
As strategic tools, these maps are excellent, but their practical application is unlocked when we ground them in systems engineering. With this link, they go from high-level diagrams to blueprints for action.
Pace Layering is not just about speed; it is a framework for temporal decomposition. It establishes stratified change velocities that dictate interface specifications, verification rigor, and failure domain isolation. This is critical for managing emergent properties and ensuring that a failure in a fast-moving layer does not cascade into a stable, foundational one.
A Wardley Map is more than a value chain diagram; it is a tool for requirements traceability. It allows us to trace a user need all the way down to its dependent components. This enables precise trade-off analysis of functional requirements against non-functional constraints (like reliability and cost) and helps define clear system boundaries.
The evolution axis enables a more quantitative approach to risk management. It allows us to apply Technology Readiness Levels (TRLs) to our components, which feeds directly into formal risk methodologies like Failure Mode, Effects, and Criticality Analysis (FMECA). This helps us model the risk of migration paths and measure our technical debt, moving to more data-informed decisions.
The combined framework directly informs verification planning and lifecycle management. It helps us answer critical, long-term questions: When should we introduce new technologies? How do we maintain a stable, known version of our systems? And how do we plan for replacing old technology before it becomes a liability?
This integration transforms strategic maps from conceptual tools into engineering artifacts that directly inform technical planning, risk management, and verification processes.
A framework for action: From diagnosis to operations
These technically grounded maps provide the perfect input for a structured strategy process. As I explored in a post on implementing an ML platform, Will Larson’s five-step framework (Explore, Diagnose, Refine, Policy, Operations) provides a robust path from analysis to action. The maps are the primary tools for the Exploration and Diagnosis phases, providing the evidence needed to build a compelling case for change.
The ground-level view: Validating the plan
Once we have a diagnosis and a proposed policy, we need to validate it. As I discussed in my post on Larson’s systems thinking approach, simple models of stocks and flows help us test our assumptions. This modelling fits perfectly into Larson’s later steps of Components of an Engineering strategy:
- Refinement is about testing our strategic hypotheses with prototypes or small-scale experiments to de-risk our ideas before committing fully.
- Operations is about creating the mechanisms for adoption and success, such as feedback loops, training, and review processes that ensure the strategy sticks.
A complete strategic toolkit
By weaving these frameworks together, we create a comprehensive approach to strategy that spans from the deepest foundations to the visible horizon.
- Landscape (Wardley & Pace Layering): We start by mapping the terrain to understand our position, using these tools to create concrete engineering artifacts.
- Process (Larson’s 5 Steps): We use a structured process to move from an evidence-based diagnosis to a concrete policy and operational plan.
- Execution (Systems Modelling): We use detailed models to refine our plans and ensure they will have the desired real-world impact.
This multi-layered toolkit moves strategy from an abstract exercise to a practical, repeatable discipline for driving meaningful change.